Sea surface temperature studies, employing multi-dated satellite thermal infra-red imagery was carried out. The aim of the study is to identify the temporal characteristics of the thermal plume signature around a coastal NPP site due to condenser coolant discharges. The task includes,
- Baseline study on the prevailing sea surface temperature pattern,
- Processing and conversion of Satellite data to derive Sea Surface Temperature by employing suitable algorithms and
- Estimation of difference between actual and measured temperature.
Baseline Study
Prior to the study on satellite based mapping of Sea Surface Temperature pattern, a preliminary baseline survey is carried out to understand the existing thermal discharge pattern at Kalpakkam site. This work involves in situ measurement of sea surface temperature (skin temperature) at intake and mixing zone i.e. the zone where the heated water/effluent meets the receiving body (i.e. final outlet) and calculation of ∆T. The in situ sea surface temperature at condenser coolant intake and mixing zone are periodically measured by employing YSI multi parameter device during the study period October 2009 to December 2012. Totally, 29 measurements were made at the above locations. The surface temperature is measured at site by dipping the probe into the water body directly. From the difference between mixing zone and intake temperature, ∆T is calculated.
The study indicate that ∆T was low during northerly current than the southerly current as latter was comparatively weaker than the former. It attributed the influence of the long shore current speed in the cooling and dispersion pattern of heated water discharge.
Mapping of Sea surface Temperature using satellite Thermal Infra Red data for the period (2000-2013)
Subsequent to the baseline study, multi-dated satellite Thermal Infra Red (TIR) image assessment has been done to demonstrate the spatial and temporal characteristics of the thermal plume signature and to determine what extent the MAPS condenser discharge influence the temperature distribution of the coastal water around the Kalpakkam coast.
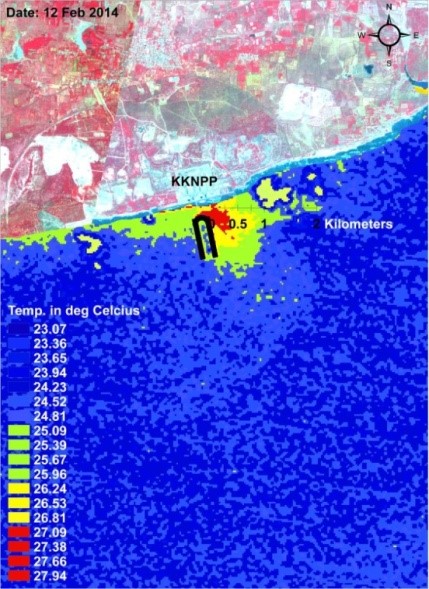
A total of 95 satellite Thermal Infra Red data (2000 to 2013) from Landsat were analyzed to know the thermal plume character with respect to seasons. The satellite data is processed to convert the Digital Numbers into brightness temperature. Also, the shape, dimensions and spreading pattern of the thermal plume are observed. The data is classified into three seasons, via. northern, southern and transitory. The seasonal behavior of the thermal plumes is also observed. From this study, it is observed that the ∆T is in the range of 0.86oC to 6.26oC.
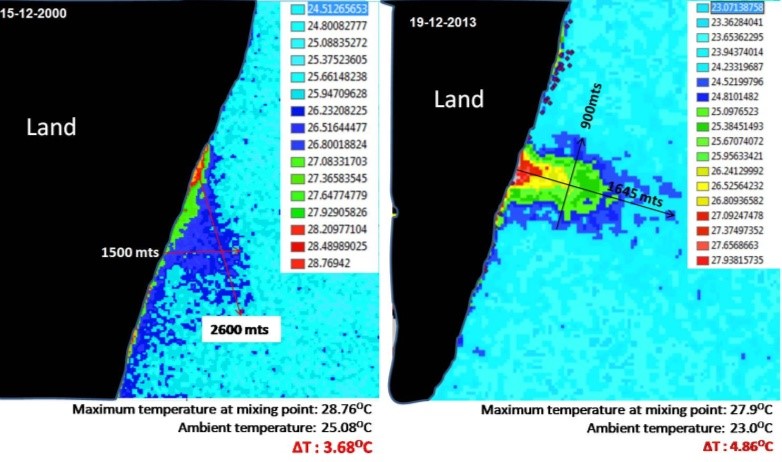
Processed satellite thermal infra red data shows the SST pattern around Kalpakkam
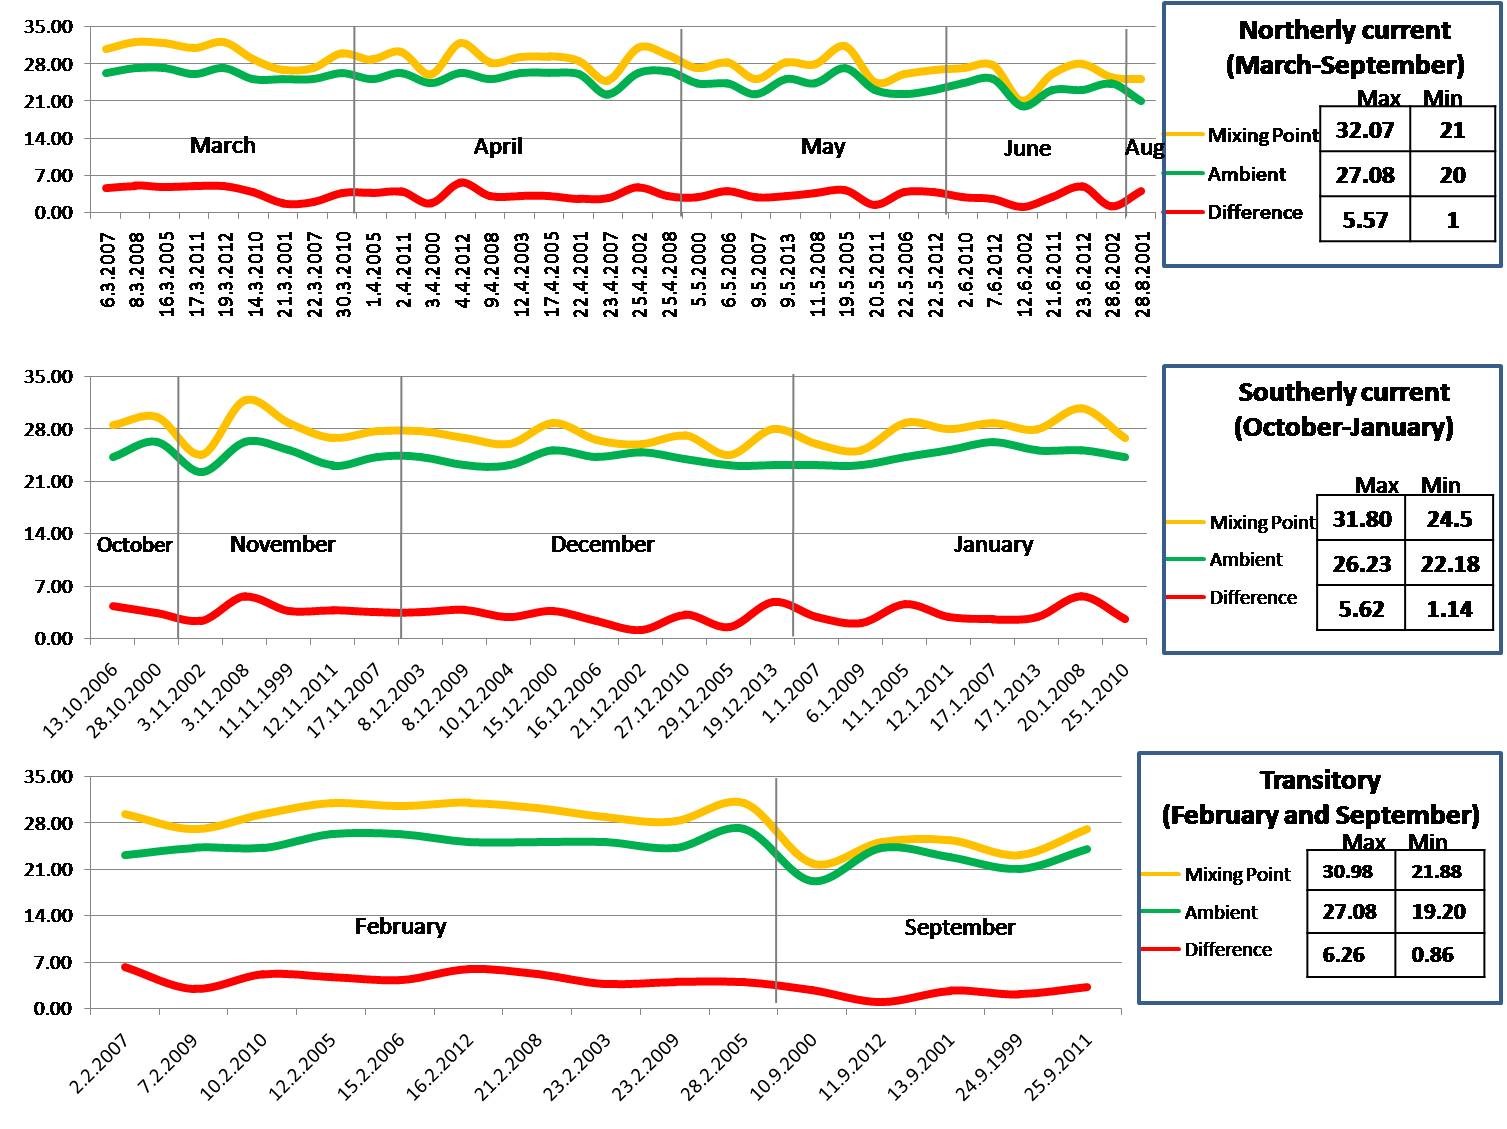
Seasonal behavior of the thermal plume
Estimation of difference between satellite derived and insitu measured SST
To calculate the difference between actual and satellite derived temperature (i.e. to validate the satellite derived temperature by comparing ‘in situ’ measured temperature) along Kalpakkam Sea, a boat expedition corresponding to the day of satellite pass on Kalpakkam has been conducted. Satellite derived SST was compared with ‘in situ’ SST and it was observed that the satellite derived SST shows lower than the in situ SST (1.5oC -4.5oC).

‘insitu’ measurement of sea surface temperature at Kalpakkam Sea
