
Page 56 - AERB
P. 56
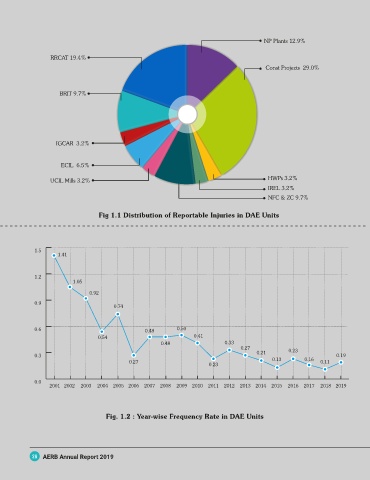
NP Plants 12.9%

                  RRCAT 19.4%
                                                                                         Const Projects  29.0%


                     BRIT 9.7%


                    IGCAR  3.2%


                     ECIL  6.5%

                  UCIL Mills 3.2%                                                         HWPs 3.2%
                                                                                          IREL 3.2%
                                                                                          NFC & ZC 9.7%


                                  Fig 1.1 Distribution of Reportable Injuries in DAE Units


            1.5
                    1.41


            1.2
                         1.05
                               0.92
            0.9
                                       0.74


            0.6                                  0.48       0.50
                                 0.54                            0.41
                                                      0.48                 0.33
                                                                                 0.27           0.23
            0.3                                                                       0.21                      0.19
                                            0.27                      0.23                 0.13       0.16  0.11


            0.0
                 2001 2002  2003  2004  2005 2006  2007  2008  2009  2010  2011  2012  2013  2014  2015  2016  2017  2018 2019


                                    Fig. 1.2 : Year-wise Frequency Rate in DAE Units


            28 AERB Annual Report 2019