
Page 119 - AERB
P. 119
in coolant temperature, fuel temperature and void are (110% of FP), reactor power and core reactivity vs. time,
also calculated. The core calculations have also been and 3D power distributions were calculated. The results
performed to find out the multiplication factor, burn- of TRIVAC were found to show the expected trend.
up distribution, power peaking factors and power
distribution throughout the Cycle-26 reload. The void 7.7.5 OECD-NEA THAI-3 Project and Analysis of THAI
distribution, MCHFR and control rod inventory have Hydrogen Deflagration Tests
also been estimated.
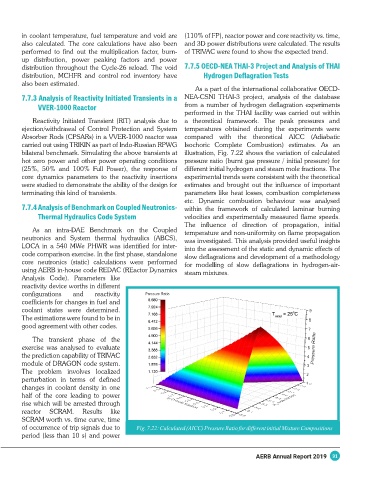
As a part of the international collaborative OECD-
7.7.3 Analysis of Reactivity Initiated Transients in a NEA-CSNI THAI-3 project, analysis of the database
VVER-1000 Reactor from a number of hydrogen deflagration experiments
performed in the THAI facility was carried out within
Reactivity Initiated Transient (RIT) analysis due to a theoretical framework. The peak pressures and
ejection/withdrawal of Control Protection and System temperatures obtained during the experiments were
Absorber Rods (CPSARs) in a VVER-1000 reactor was compared with the theoretical AICC (Adiabatic
carried out using TRIKIN as part of Indo-Russian RPWG Isochoric Complete Combustion) estimates. As an
bilateral benchmark. Simulating the above transients at illustration, Fig. 7.22 shows the variation of calculated
hot zero power and other power operating conditions pressure ratio (burnt gas pressure / initial pressure) for
(25%, 50% and 100% Full Power), the response of different initial hydrogen and steam mole fractions. The
core dynamics parameters to the reactivity insertions experimental trends were consistent with the theoretical
were studied to demonstrate the ability of the design for estimates and brought out the influence of important
terminating this kind of transients. parameters like heat losses, combustion completeness
etc. Dynamic combustion behaviour was analysed
7.7.4 Analysis of Benchmark on Coupled Neutronics- within the framework of calculated laminar burning
Thermal Hydraulics Code System velocities and experimentally measured flame speeds.
The influence of direction of propagation, initial
As an intra-DAE Benchmark on the Coupled temperature and non-uniformity on flame propagation
neutronics and System thermal hydraulics (ABCS), was investigated. This analysis provided useful insights
LOCA in a 540 MWe PHWR was identified for inter- into the assessment of the static and dynamic effects of
code comparison exercise. In the first phase, standalone slow deflagrations and development of a methodology
core neutronics (static) calculations were performed for modelling of slow deflagrations in hydrogen-air-
using AERB in-house code REDAC (REactor Dynamics steam mixtures.
Analysis Code). Parameters like
reactivity device worths in different
configurations and reactivity
coefficients for changes in fuel and
coolant states were determined.
The estimations were found to be in
good agreement with other codes.
The transient phase of the
exercise was analysed to evaluate
the prediction capability of TRIVAC
module of DRAGON code system.
The problem involves localized
perturbation in terms of defined
changes in coolant density in one
half of the core leading to power
rise which will be arrested through
reactor SCRAM. Results like
SCRAM worth vs. time curve, time
of occurrence of trip signals due to Fig. 7.22: Calculated (AICC) Pressure Ratio for different initial Mixture Compositions
period (less than 10 s) and power
AERB Annual Report 2019 91